
Viewport Scopes
Editor scopes for the active level viewport: waveform, histogram, vectorscope, false color, grayscale, and zebra. Viewport Scopes helps locate crushed shadows and overbright areas, keep exposure consistent, and check color balance against art direction.
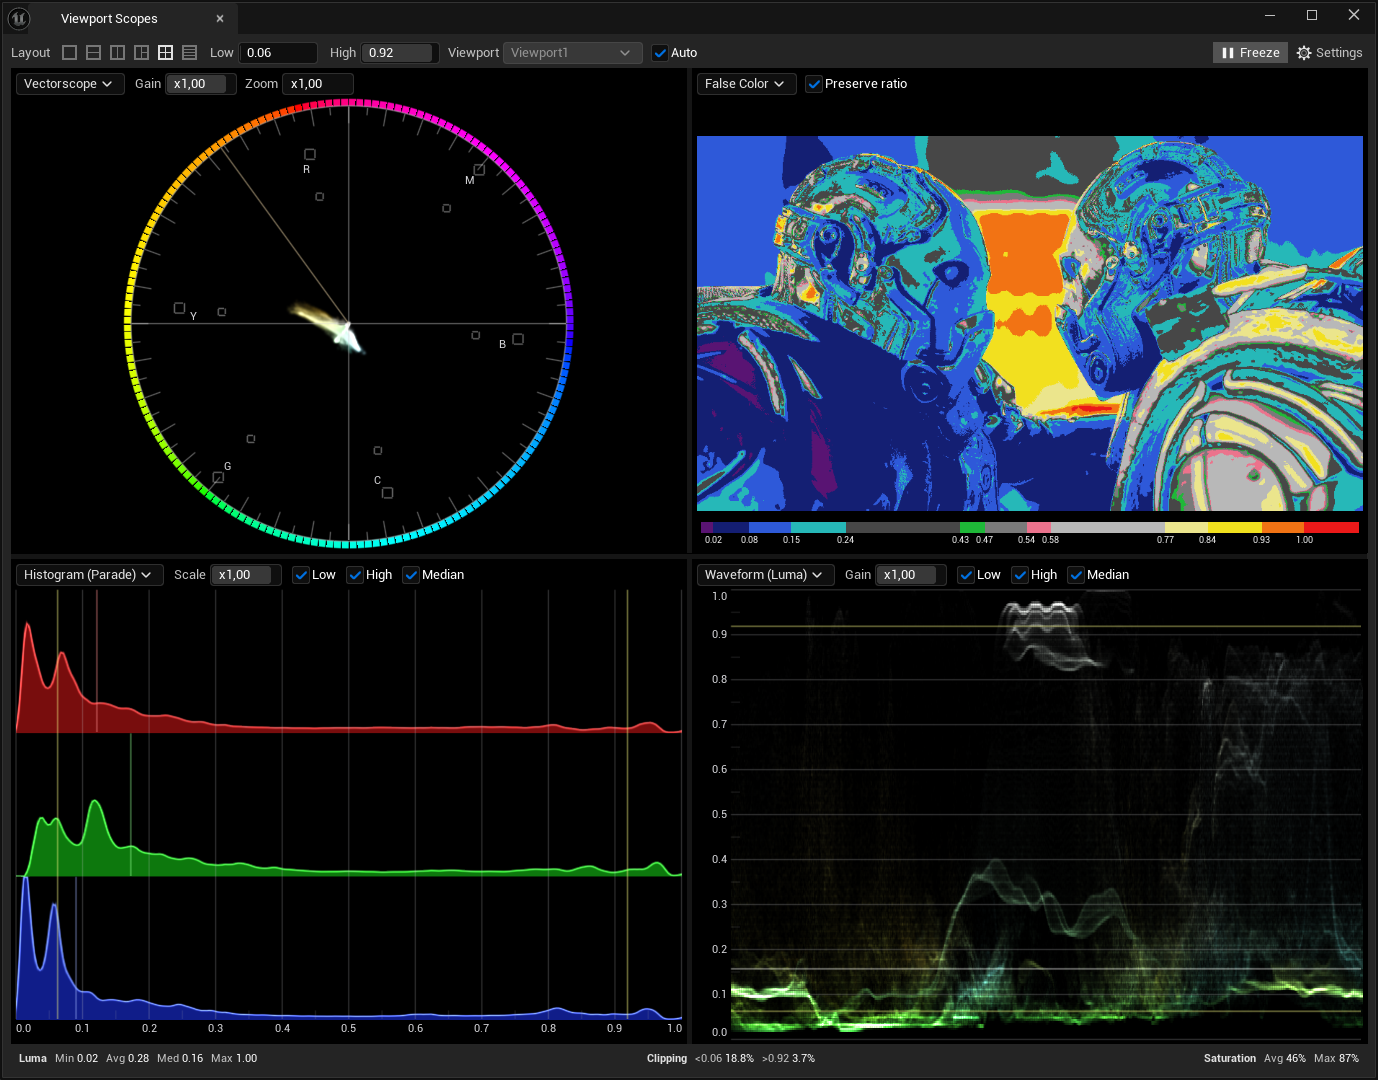
Overview
Viewport Scopes is a dockable Unreal Editor window with one to four scope panels. Each panel can show a different mode. The plugin samples the level viewport as displayed, then updates the scopes and optional image statistics.
- Open from Window → Viewport Scopes or the Level Editor toolbar
- Six layout presets; each keeps its own panel setup
- Shared Low / High reference markers, Freeze, and viewport selection
Getting Started
- Close the Unreal Editor.
- Copy the ViewportScopes folder into your project’s
Pluginsdirectory (createPluginsnext to the.uprojectif needed). - Open the project, enable Viewport Scopes if prompted, and restart if required.
- Open a level with a visible viewport, then choose Window → Viewport Scopes or the toolbar button.
- Choose a layout and set each panel to the scope you need.

The toolbar button can be hidden under Settings → General without removing the Window menu entry.
What It Reads
Scopes analyze the viewport image as displayed — after tonemapping and display — so the readout matches what you see in the editor.
Scale Mode only changes how numbers are labeled (for example 0–1, percent, or 0–1023). It does not change capture or the rendered image.
Choosing a Scope
Each panel displays one mode. Select the mode that matches the check you want to make.
Waveform
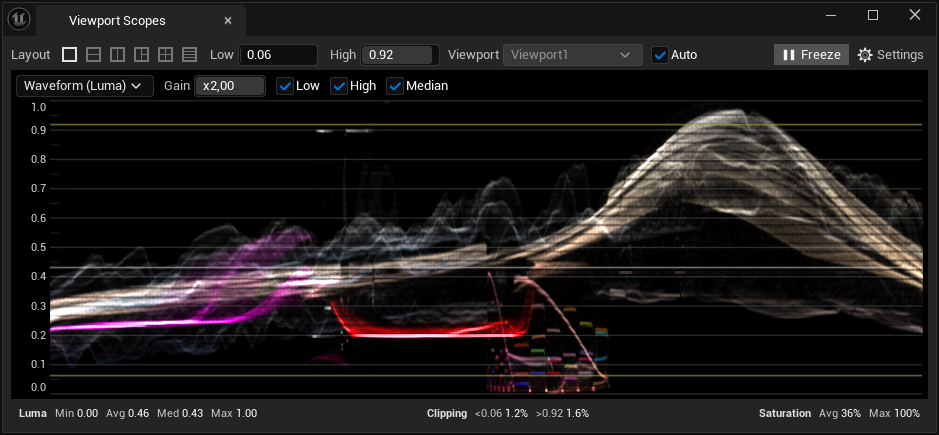
Waveform plots brightness across the frame from left to right. Viewport Scopes helps locate crushed shadows and overbright areas so exposure stays aligned with art direction. RGB and parade variants show channel balance; luma shows overall brightness.
Histogram
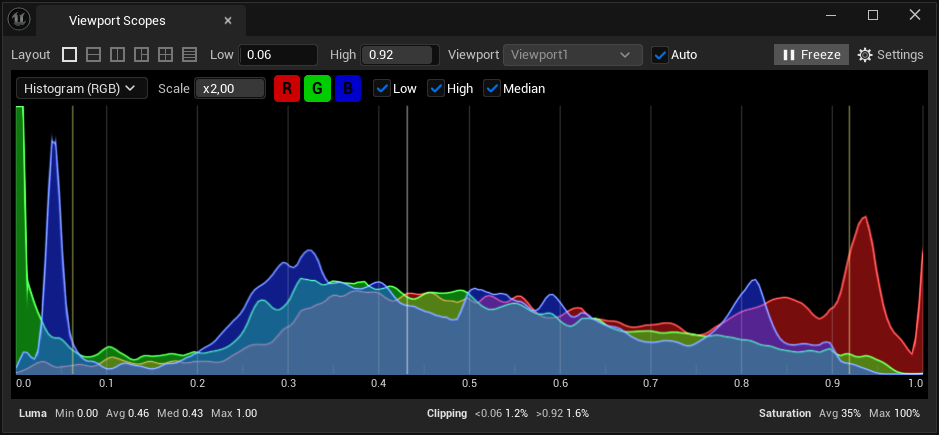
Histogram shows how much of the image sits in shadows, midtones, and highlights. It helps judge overall exposure shape, clipping at either end, and channel imbalance. Parade separates R, G, and B for clearer channel comparison.
Vectorscope
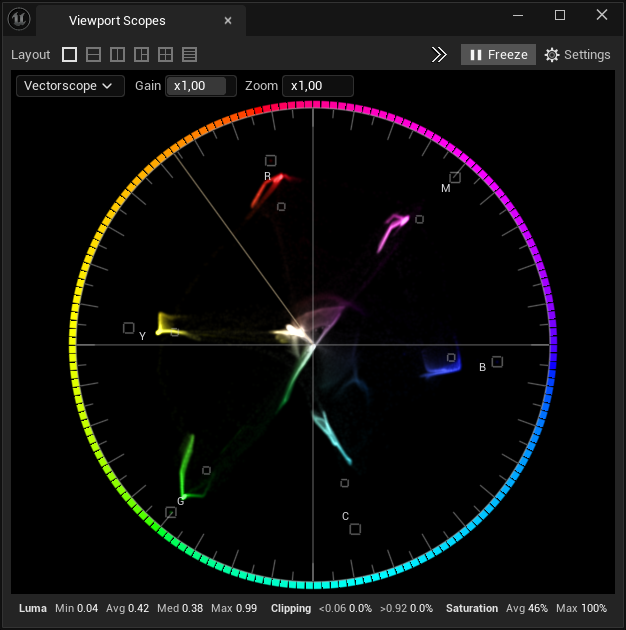
Vectorscope shows hue and saturation as a color cloud. It helps check palette intensity, color casts, and whether skin tones sit in a stable range. Target markers mark primary and secondary colors for reference.
Under the hood, chroma is plotted as Cb/Cr: angle corresponds to hue, distance from center to saturation. Gain brightens the cloud for readability; Zoom enlarges the cloud and targets while the outer graticule stays fixed.
False Color
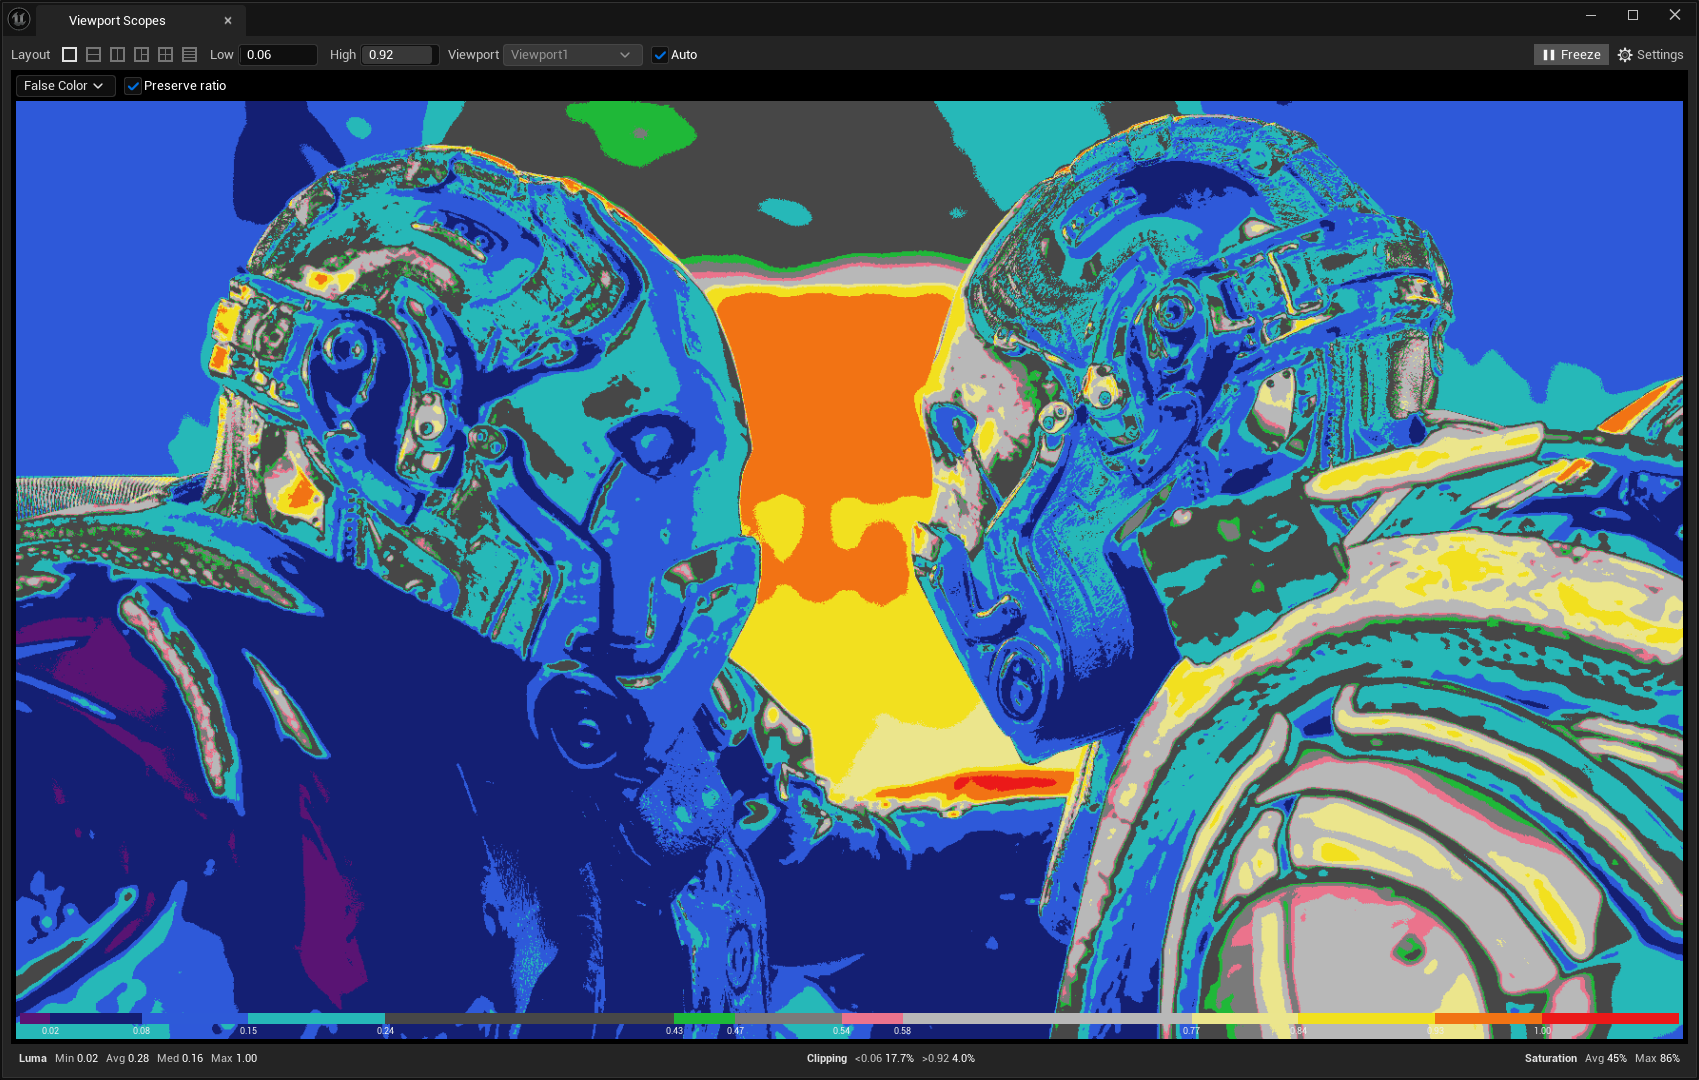
False Color maps brightness to solid bands so exposure problems are easy to see. Typical reading: purple for crushed areas, blues for shadows, green near middle grey, warmer tones through the highlights, red for clipping.
Grayscale
Grayscale removes hue so brightness and contrast can be judged on their own — useful for silhouette, key-to-fill balance, and whether the image still reads without color. Several conversion models are available; the default is a solid starting point.
Zebra
Zebra overlays stripes on areas below Low or above High — blue for underexposure, red for overexposure. It marks problem regions directly on the image. By default zebra follows the shared Low / High markers; custom per-panel levels are optional.
Layouts
Lighting, lookdev, and review often need different combinations of scopes. Layout presets let you run one large scope or several at once. Each layout remembers its own panel choices and splitter sizes, so switching modes does not overwrite other setups.
- Single — one scope fills the window
- Two Vertical / Two Horizontal — pair two tools
- Three Left Large — one large panel plus two supporting panels
- Four Grid / Four Vertical — multi-scope monitoring board

Defaults are a starting point (for example Four Grid opens with vectorscope, false color, histogram parade, and waveform luma). Change any panel as needed.
Controls
Controls appear based on the active scope.
- Scale (Histogram) — raises or lowers plot height so sparse levels are easier to read. Does not change the sampled image.
- Gain (Waveform, Vectorscope) — adjusts display brightness of the plot or color cloud so weak or dense areas are visible. Does not change viewport exposure.
- R / G / B — isolate channels on RGB histogram and waveform
- Low / High lines — shared reference markers for exposure judgment on histogram and waveform
- Median — marks the median brightness of the frame (or per-channel medians in parade modes). Median is more stable than average when a few hot pixels or large dark areas would skew the mean, so it is a reliable cue for where the bulk of the image sits and how far that sits from your Low / High targets.
- Vectorscope Zoom — enlarges the color cloud for finer hue and saturation checks
- Preserve Aspect — keeps false color / grayscale / zebra from stretching in the panel
- Zebra custom levels — optional per-panel Low / High instead of the shared markers
Shared Low and High apply across layouts. Scale Mode in Settings only changes how those values are labeled.
Freeze
Freeze pauses viewport capture and holds the last scopes and statistics. It is most useful when the frame is moving — particles, effects, clouds, camera motion, or any animation that would otherwise keep the plots shifting while you read them.
Viewport Selection
The toolbar Viewport control chooses which level viewport is sampled.
- Auto (default) — follows the Level Editor’s currently active viewport. Click another viewport to make it active, and scopes switch to that view. The dropdown shows the resolved viewport name but stays disabled while Auto is on.
- Auto off — pin a specific viewport from the dropdown. Scopes keep sampling that view even if another viewport becomes active. Useful when you work with multiple views and want scopes locked to a hero camera or a dedicated monitor viewport.
If the pinned viewport disappears, the plugin falls back to an available level viewport. The viewport list refreshes from open level viewports in the editor.
Settings
Settings follow the same groups as in the plugin.
Appearance
- Scale Mode — numeric labels for grids, Low / High, statistics, and false-color legend (0–1, percent, 8-bit, 10-bit-style, or 0–100 full scale). Does not affect capture.
- Graticule Opacity — opacity of scope grids and the vectorscope graticule
- Reference Line Opacity — opacity of Low, High, and Median lines on histogram and waveform
- Show Image Statistics — toggle the statistics strip under the layout
Capture Settings
- Analysis Resolution — size of the analysis capture (see Optimization)
- Refresh Rate — how often scopes update, 5–30 Hz (see Optimization)
General
- Show Toolbar Icon — Level Editor toolbar button
- Reset Plugin Settings — restore appearance, capture, and all layout presets; keeps the current layout mode and toolbar preference
- Reset Current Layout — reset only the active layout’s panels and splits
Optimization
Scopes capture the viewport and run GPU analysis on a timer. On heavy scenes that cost can show up as lower editor responsiveness. Capture Settings control that cost.
- Analysis Resolution — lowers or raises how many pixels are sampled. Full viewport keeps maximum detail; 50%, 1280w, 640w, or 320w reduce work (aspect is preserved). Lower resolution means less data per update, which reduces GPU load and helps keep the editor frame rate steadier.
- Refresh Rate — how many times per second scopes capture and redraw (5, 10, 15, 20, 25, or 30 Hz). Each tick costs capture + analysis time. Lower rates space those ticks out so more frame budget remains for the editor; higher rates feel more live while lighting.
If the editor feels heavy with Viewport Scopes open, lower Analysis Resolution first, then Refresh Rate, until the balance between responsiveness and scope detail works for the scene.
Image Statistics
When enabled, a strip under the layout reports values from the current analysis:
- Luma min / average / median / max — brightness range. Median is especially useful: it shows where the bulk of the image sits without being pulled as hard by a few clipped highlights or large empty dark regions, so it is a practical reference when matching exposure to art direction.
- Median R / G / B — per-channel balance at a glance
- Clip below Low / above High — how much of the image sits outside your markers
- Saturation average / max — overall color intensity summary
While frozen, stats stay on the last capture. Changing Low / High can refresh clip percentages without a new capture.
Saving Your Setup
Layouts, panel choices, and controls are saved with the project. App settings (scale mode, opacities, statistics visibility, capture settings, toolbar icon, viewport selection) are saved as well and restore with the window.
Requirements
- Unreal Engine 5.5–5.8 (Windows Editor)
- Use the package built for your engine version (for example
UE_5.5,UE_5.6) - Editor plugin only — not included in cooked game builds
Support
Questions or issues: support@iron-plum.com